If anyone is worried about the price of Bitcoin or other cryptocurrencies in this current bearish atmosphere let this chart reassure you about Bitcoin price direction. The chart looks the same for many other cryptocurrencies as well. Don't let the FUD get you down. The chart removes the intervening highs (volatility) to emphasize price direction. Bitcoin (after rising 18,000 percent since 2015) is still sitting pretty and still works as a longer term investment (not investment advice).
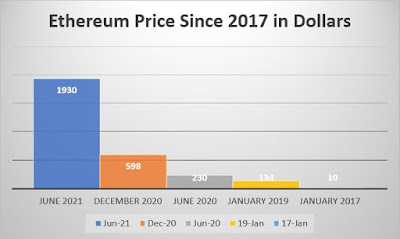
And here's Ethereum!
Prices from coinmarketcap.com
Check out: The Essential Guide to Bitcoin Mining: A Cryptocurrency Tutorial


No comments:
Post a Comment